Maine Election-Day Penny Poll
Concerning
Federal Expenditure Preferences
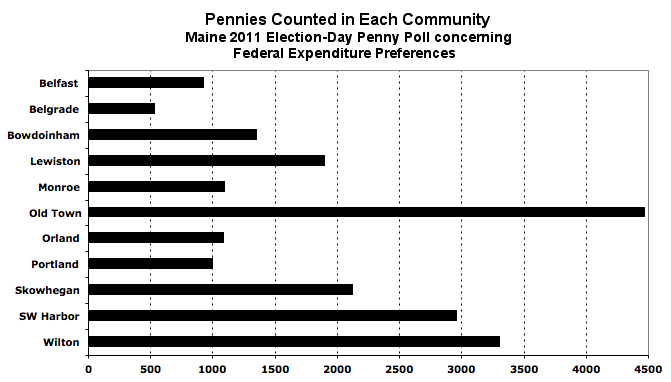
Held among registered voters at polling places in 11 communities on Election Day, 2011
Sponsored by the Maine Bring Our War $$ Home Campaign
About The Poll
|
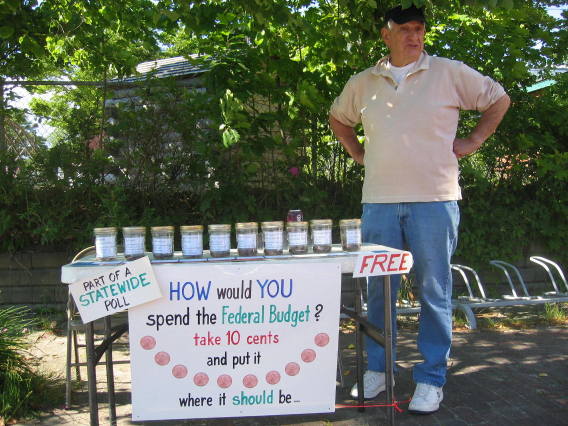
How it was done -- Voters exiting the polls were encouraged to take 10 pennies that were offered to them and distribute them among 10 jars labeled with ten categories of federal discretionary spending in porportion to the way they would prefer to see their tax dollars spent. (Note: "discretionary" spending excludes insurance programs such as Social Security and Medicare, and payment on the principal of the national debt.)
The Categories -- The categories and examples with which the jars were labelled were as follows (click to see the results by town for the given category):
The examples provided for these categories were mutually exclusive in the eyes of people of various ideological or political views. For instance, people who like the idea of food stamps might not appreciate subsidies of large-scale agribusiness, while people who think environmental protection is important might not approve of space exploration. Having to make decisions based on the categories as presented made the job of deciding more difficult than some expected, but it mirrored the problem members of Congress have when a favorite bill gets watered down or loaded with unwanted riders. The Towns -- The original dry run of the poll run in the summer aimed at (and succeeded in) getting at least one town in each county. The towns for the Election Day poll were selected by a very important criterion -- towns where volunteers were available (click a town to see its results): |
Federal Expenditure Preferences of the Maine Voters Polled
BY TOWN
Percentages, with number of participants
(See also By Category)
Click on graph for printable PDF
Belfast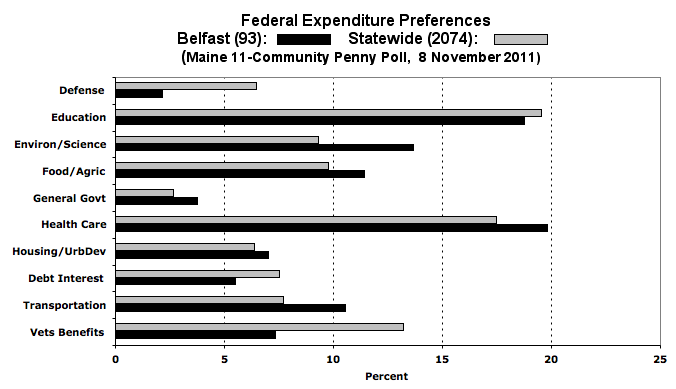
|
Belgrade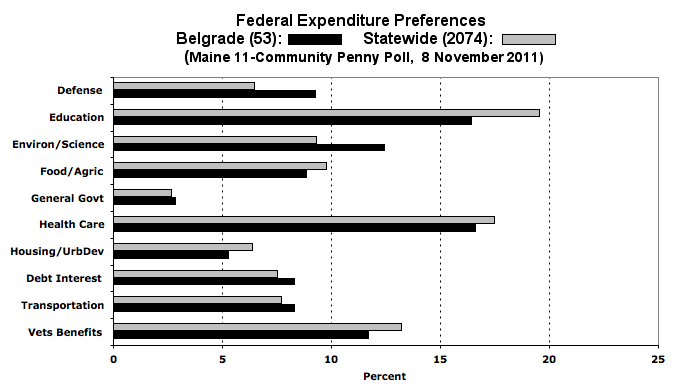
|
Bowdoinham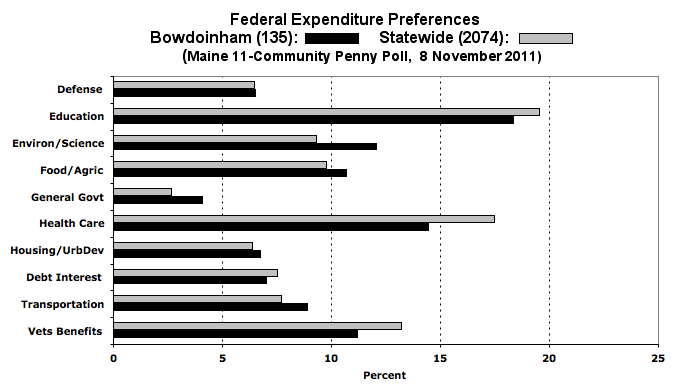
|
Lewiston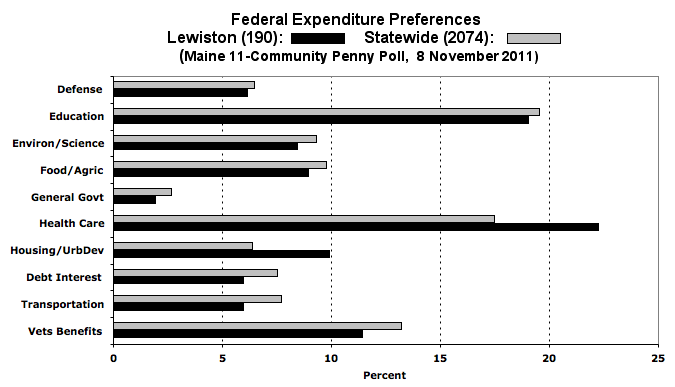
|
Monroe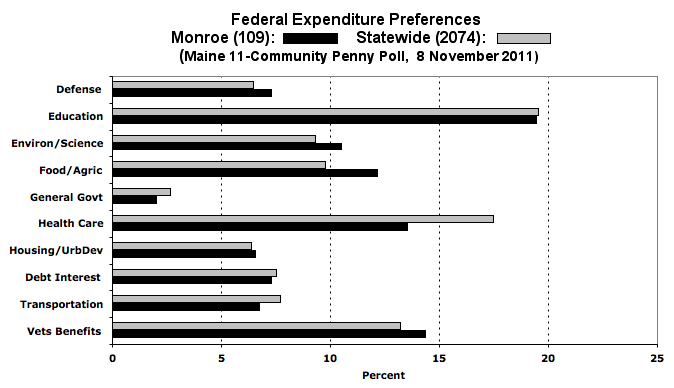
|
Old Town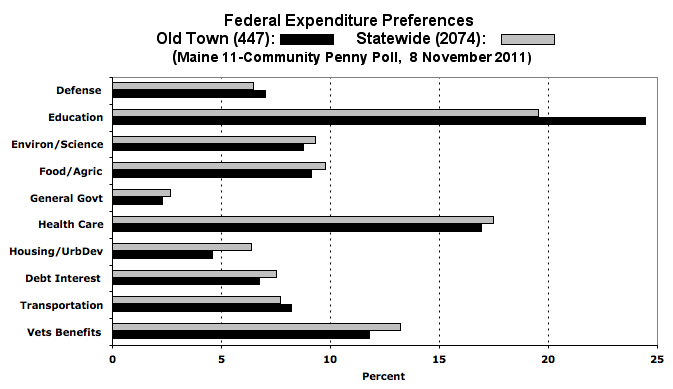
|
Orland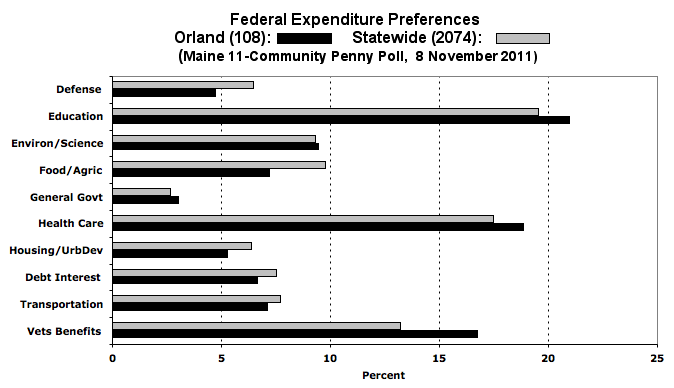
|
Portland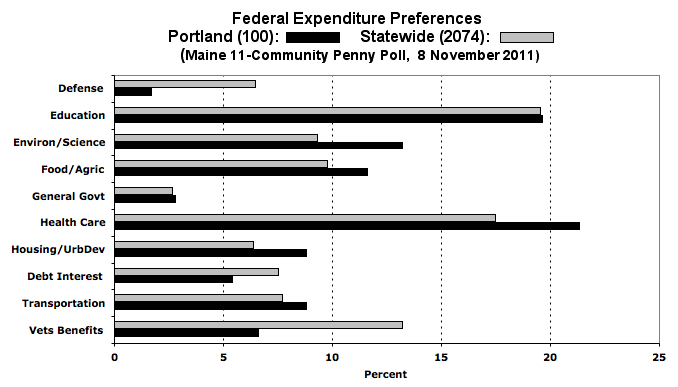
|
Skowhegan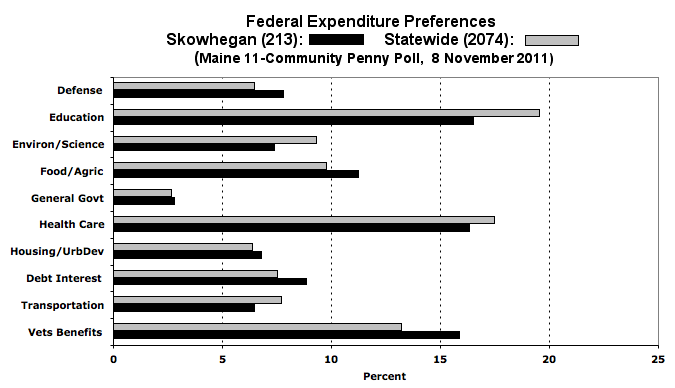
|
Southwest Harbor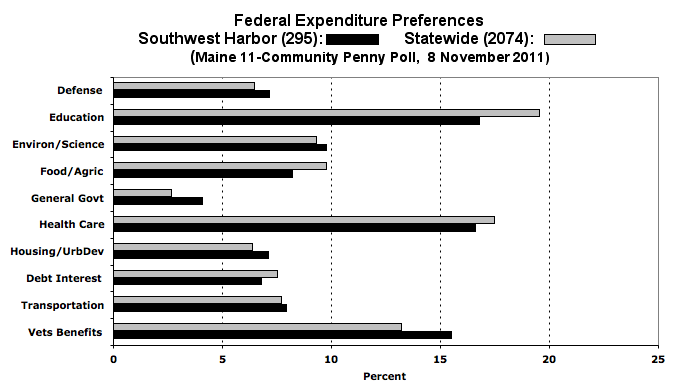
|
Wilton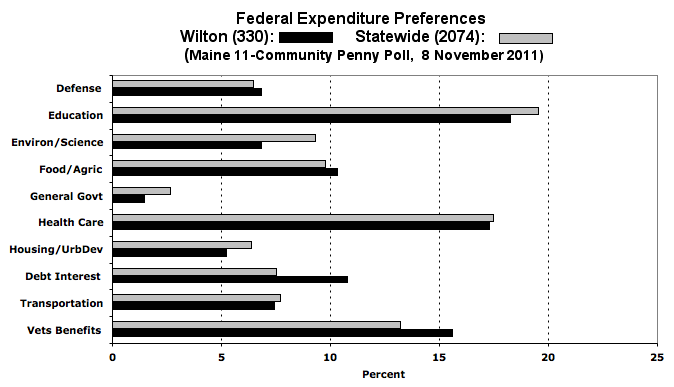
|
BY CATEGORY
Percentages
(See also By Town)
Click on graph for printable PDF
Defense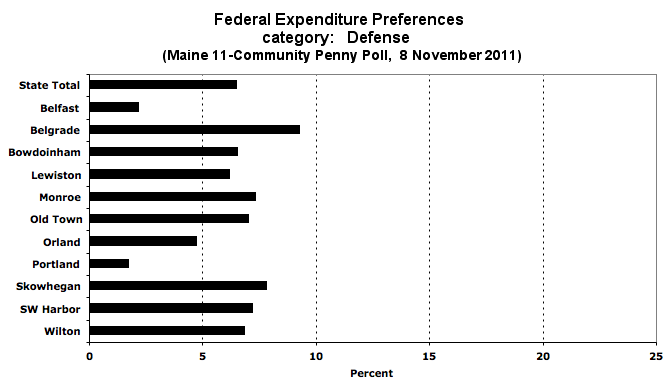
|
Education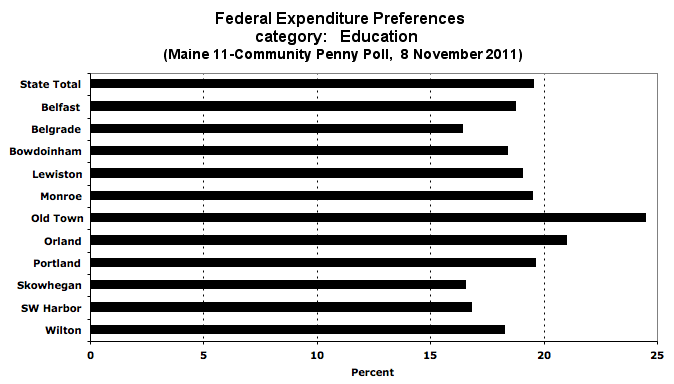
|
Environment / Science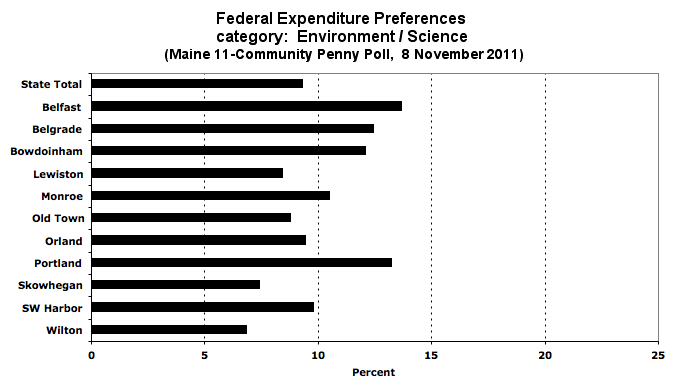
|
Food / Agriculture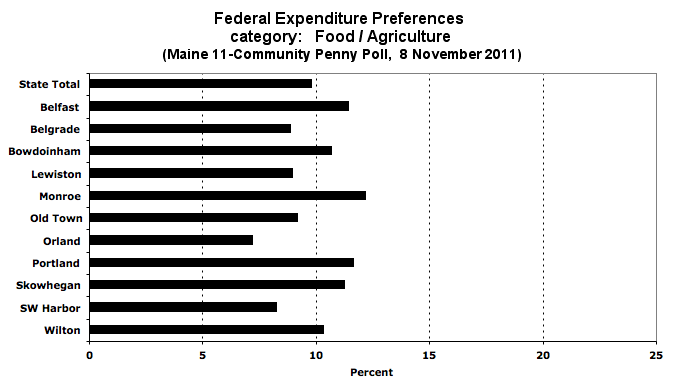
|
General Government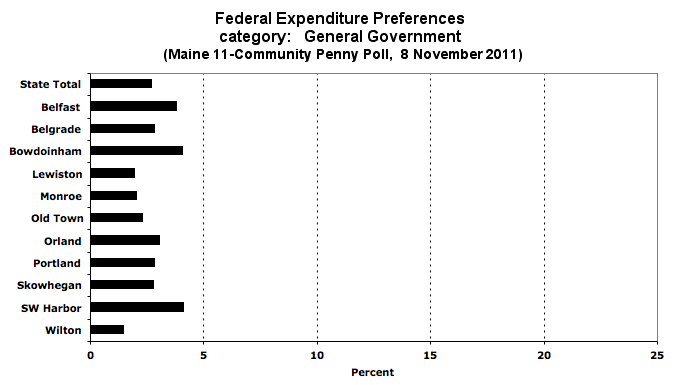
|
Health Care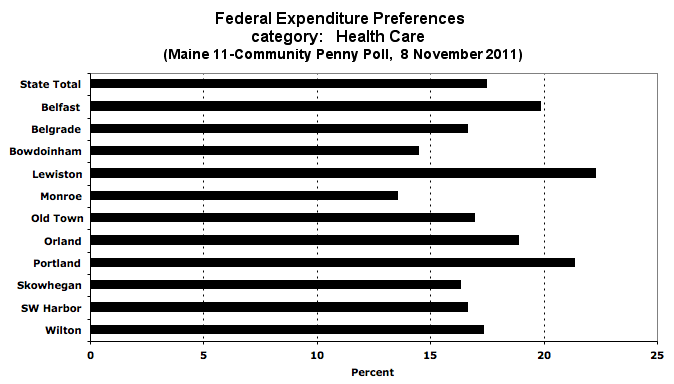
|
Housing / Urban Development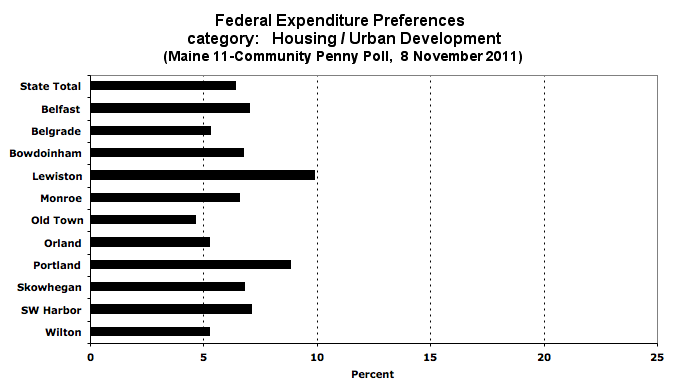
|
Interest on Natioinal Debt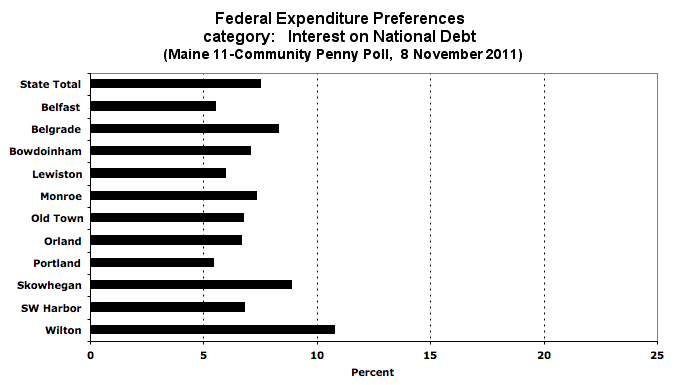
|
Transportation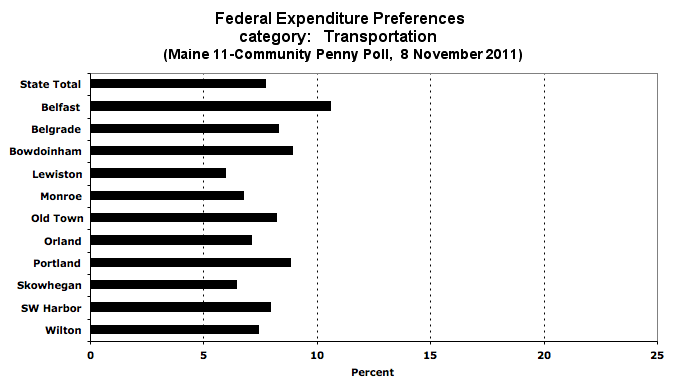
|
Veterans Benefits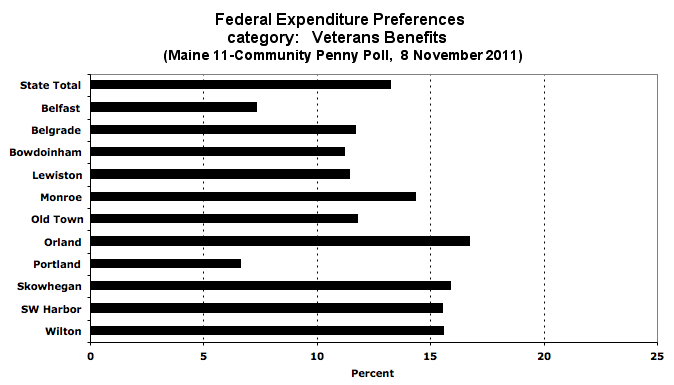
|
DATA
(see also the data/graph spreadsheet)
|
| ||||||||||||||||||||||||||||||||||||||||||||||||||||||||||||||||||||||||||||||||||||||||||||||||||||||||||||||||||||||||||||||||||||||||||||||||||||||||||||||||||||||||||||||||||||||||||||||||||||||||||||||||||||||||||||||||||||||||||||||||||||||||||
Last updated: 24 November 2011