How Much Deficit Does Unemployment Cost?
Answer: A lot!
|
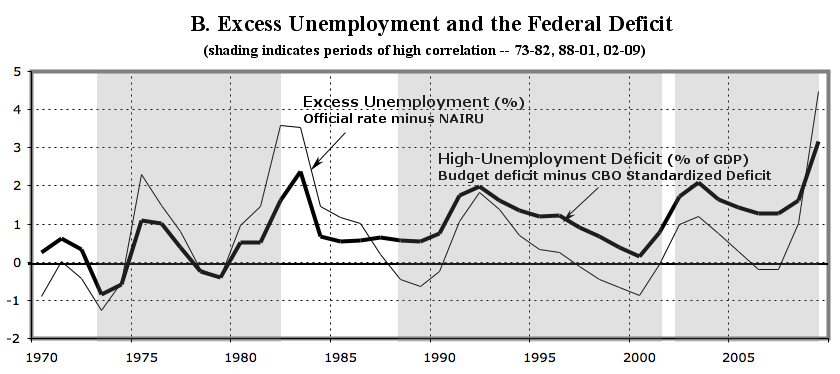
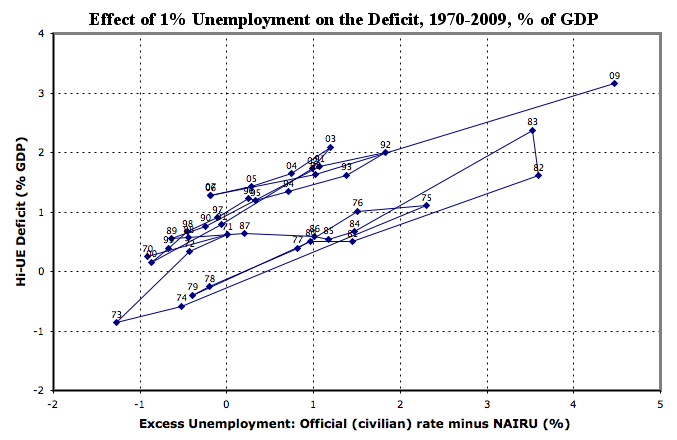
There is a lot of arguing going on about the dangers of increasing the deficit and debt by using federal government spending to end the present high level of unemployment. Whether this is innocent ignorance or a disingenuous, politically-motivated smokescreen, it is an irrelevant argument. An examination of the relevant economic data indicates that if this depression is allowed to continue at the present high level of unemployment, it will cause a serious, ongoing, automatic increase of hundreds of billions in the deficit and debt. In fact, as shown below, each 1% of excess unemployment is automatically adding nearly $60 billion to the deficit. The bottom line is that, for our present 10%-unemployment situation -- compared to the 4% experienced (without significant inflation) back in 2000, before the Bush administration -- the depression contibution to the deficit at 10% vs 4% unemployment = $360 billion Ironically, this is almost half the amount of the much-fought-over and eventually-reduced one-time stimulus package of last year. And this excess spending might go on indefinitely in a "jobless recovery" if too little federal spending is applied to generate a quick reduction of unemployment. Both of these approaches involve deficit spending. But we have a choice in the quality and results of that spending: We can WASTE money on continued automatic high-unemployment deficit spending OR we can INVEST money in quickly cutting off those automatic deficits and improving the nation The close correlation between excess unemployment and increases in the federal deficit can be seen clearly in Figure A's time-ordered scatterplot (and in Figure B's parallel movements of the two series): 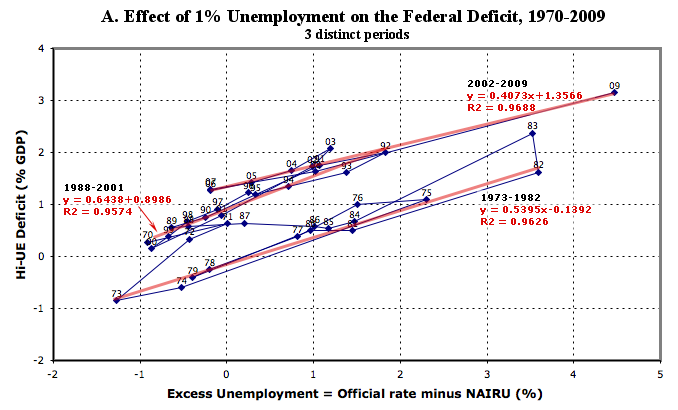
The relationship illustrated by this scatterplot is between two series derived from Congressional Budget Office and Bureau of Labor Statistics data:
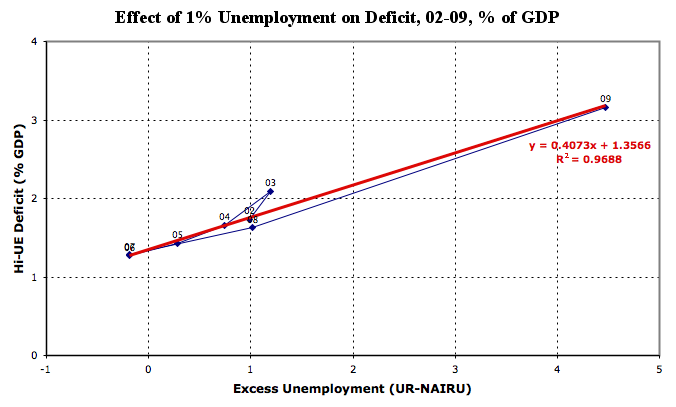
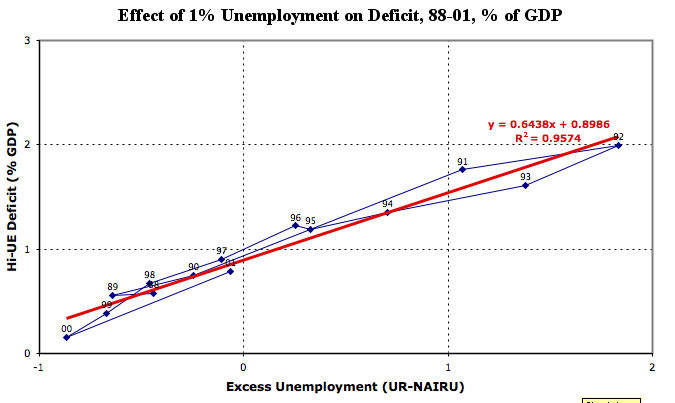
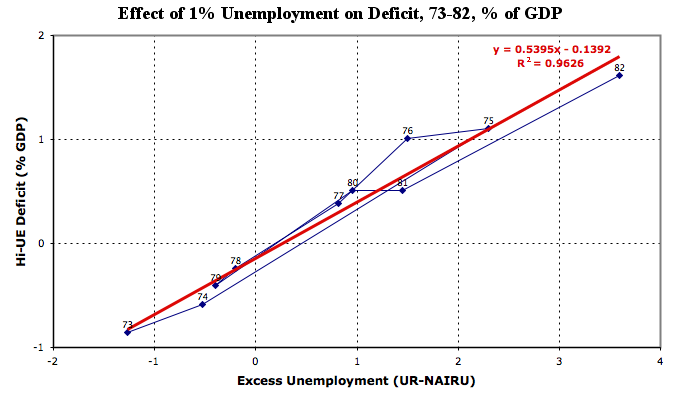
The chart shows three distinct periods in the four decades from 1970-2009 -- 1973-1982, 1988-2001, and 2002-2009 [4]. The regression lines for these periods indicate a high degree of correlation, with R values .96 or .97. The slopes indicate the deficit/unemployment relationship during that period; for the most recent, the value is .41. This indicates that, between 1988 and 2009, each 1% change in unemployment above the NAIRU level (currently 4.8%) produced a corresonding change in the deficit of 0.41% percent of GDP. At that rate, with GDP currently at around $14.7 trillion, each 1% of excess unemployment is adding $60 billion to the deficit, or, as pointed out above, the depression contibution to the deficit at 10% vs 4% unemployment = $350 billion Ironically, this is almost half the amount of the much-fought-over and eventually-reduced one-time stimulus package of last year. And this excess spending might go on indefinitely in a "jobless recovery" if too little federal spending is applied to generate a quick reduction of unemployment. Both of these approaches involve deficit spending. But we have a choice in the quality and results of that spending: We can WASTE money on continued automatic high-unemployment deficit spending OR we can INVEST money in quickly cutting off those automatic deficits and improving the nation |
